Pro Forma Analysis
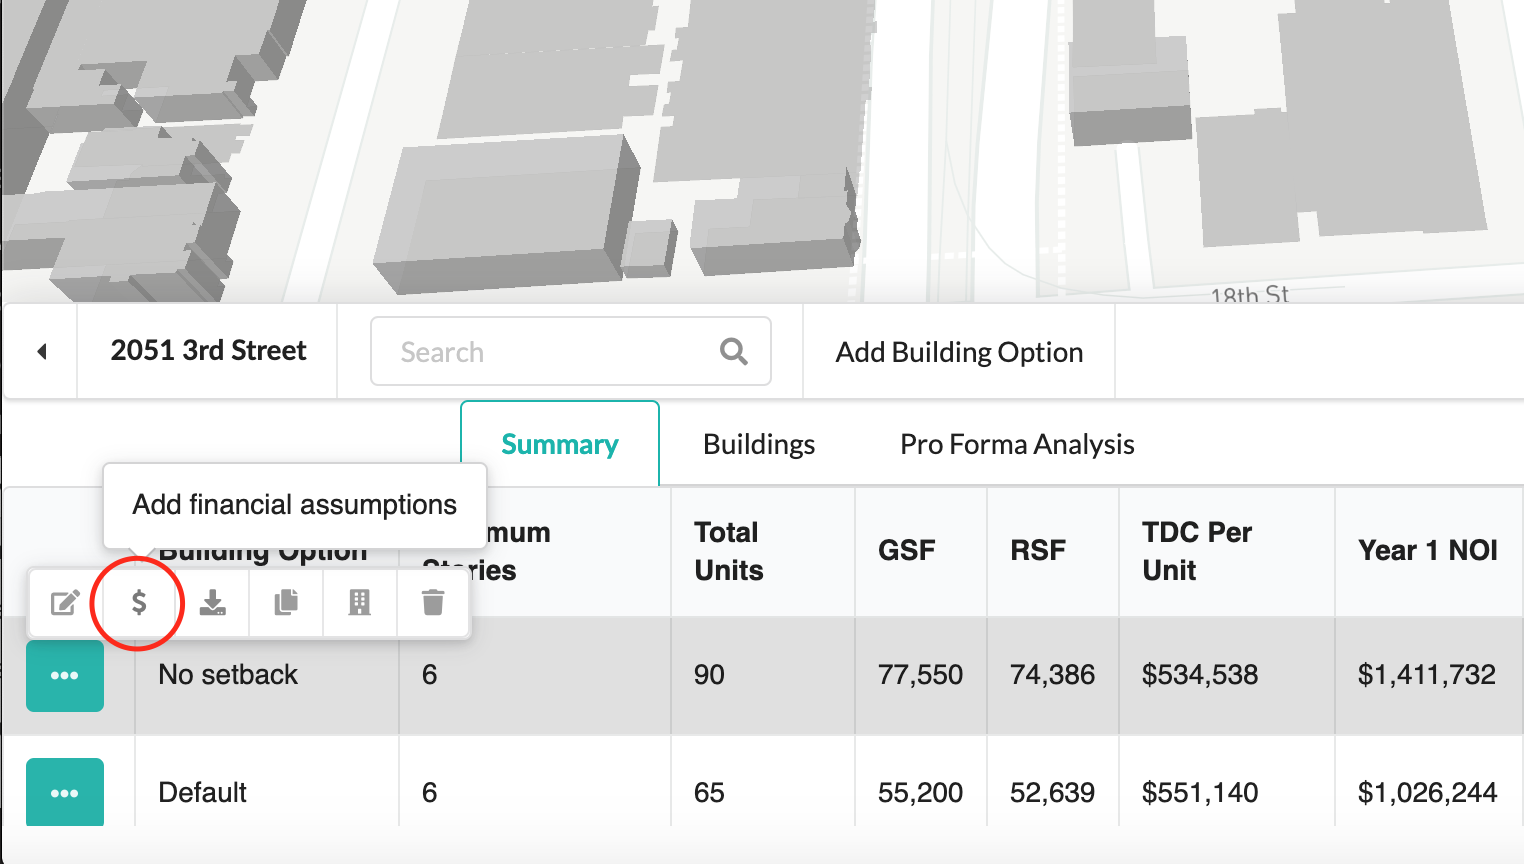
The pro forma analysis tool draws on the generated unit count of the building options section. You will need to create a building option in order to start the financial analysis. To access the pro forma tool, click the turquoise button to the left of the building option in the summary table and select the ‘$’. This will pull up the pro forma wizard, which allows you to click through development costs, operating period assumptions and sources of funds.
Development Costs
You can quickly enter a total development cost per unit, which includes land and acquisition costs, or build out a more detailed development cost pro forma. Entering a total development cost per unit allows you to make quick development cost assumptions based on comparable projects.
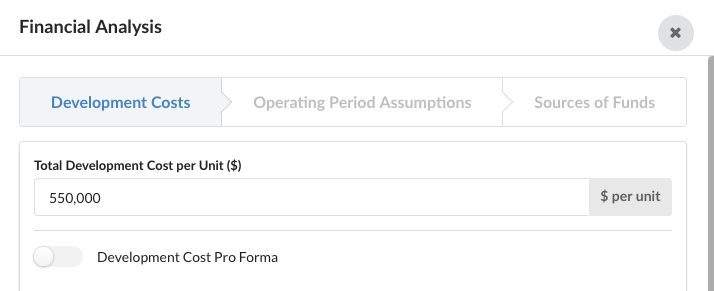
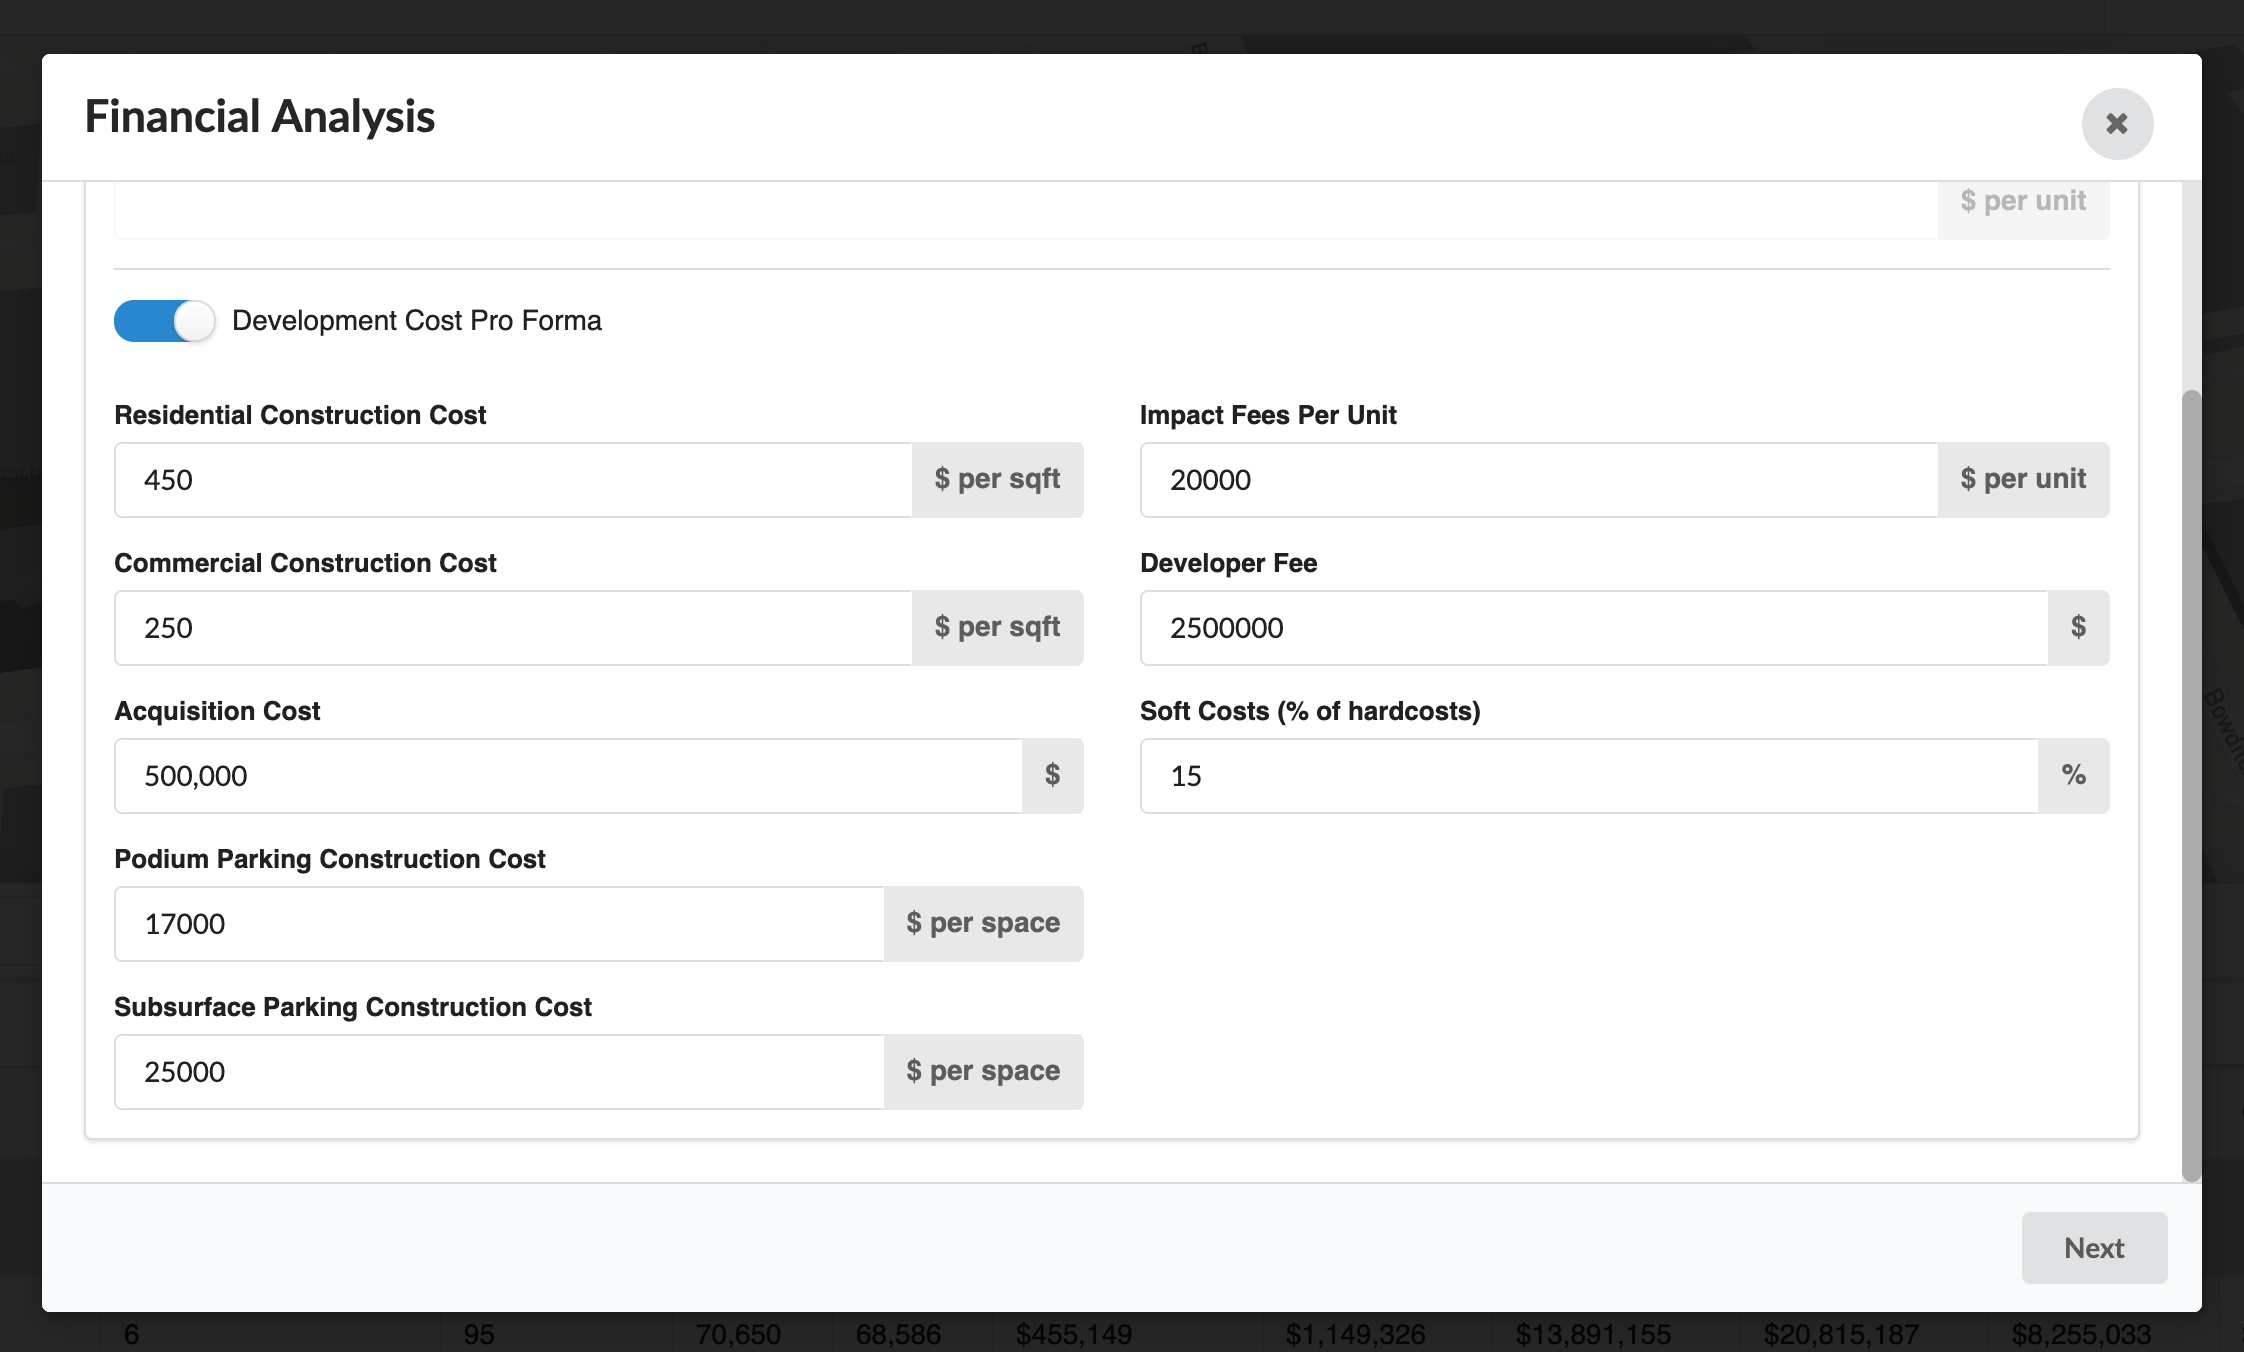
To complete a more detailed analysis on a cost per square foot basis, toggle the ‘Development cost pro forma’ button.
- Input the following cost assumptions:
Residential construction cost ($ per sf/m)
Commercial construction cost ($ per sf/m)
Acquisition cost (land and other acquisition costs)
Parking construction cost ($ per space)
Impact fees per unit
Developer fee
Soft costs (% of hard costs)
Podium parking construction cost ($ per space)
Subsurface parking construction cost ($ per space)
Leaving the acquisition cost input blank will allow you to perform a residual land value analysis.
Operating Period Assumptions
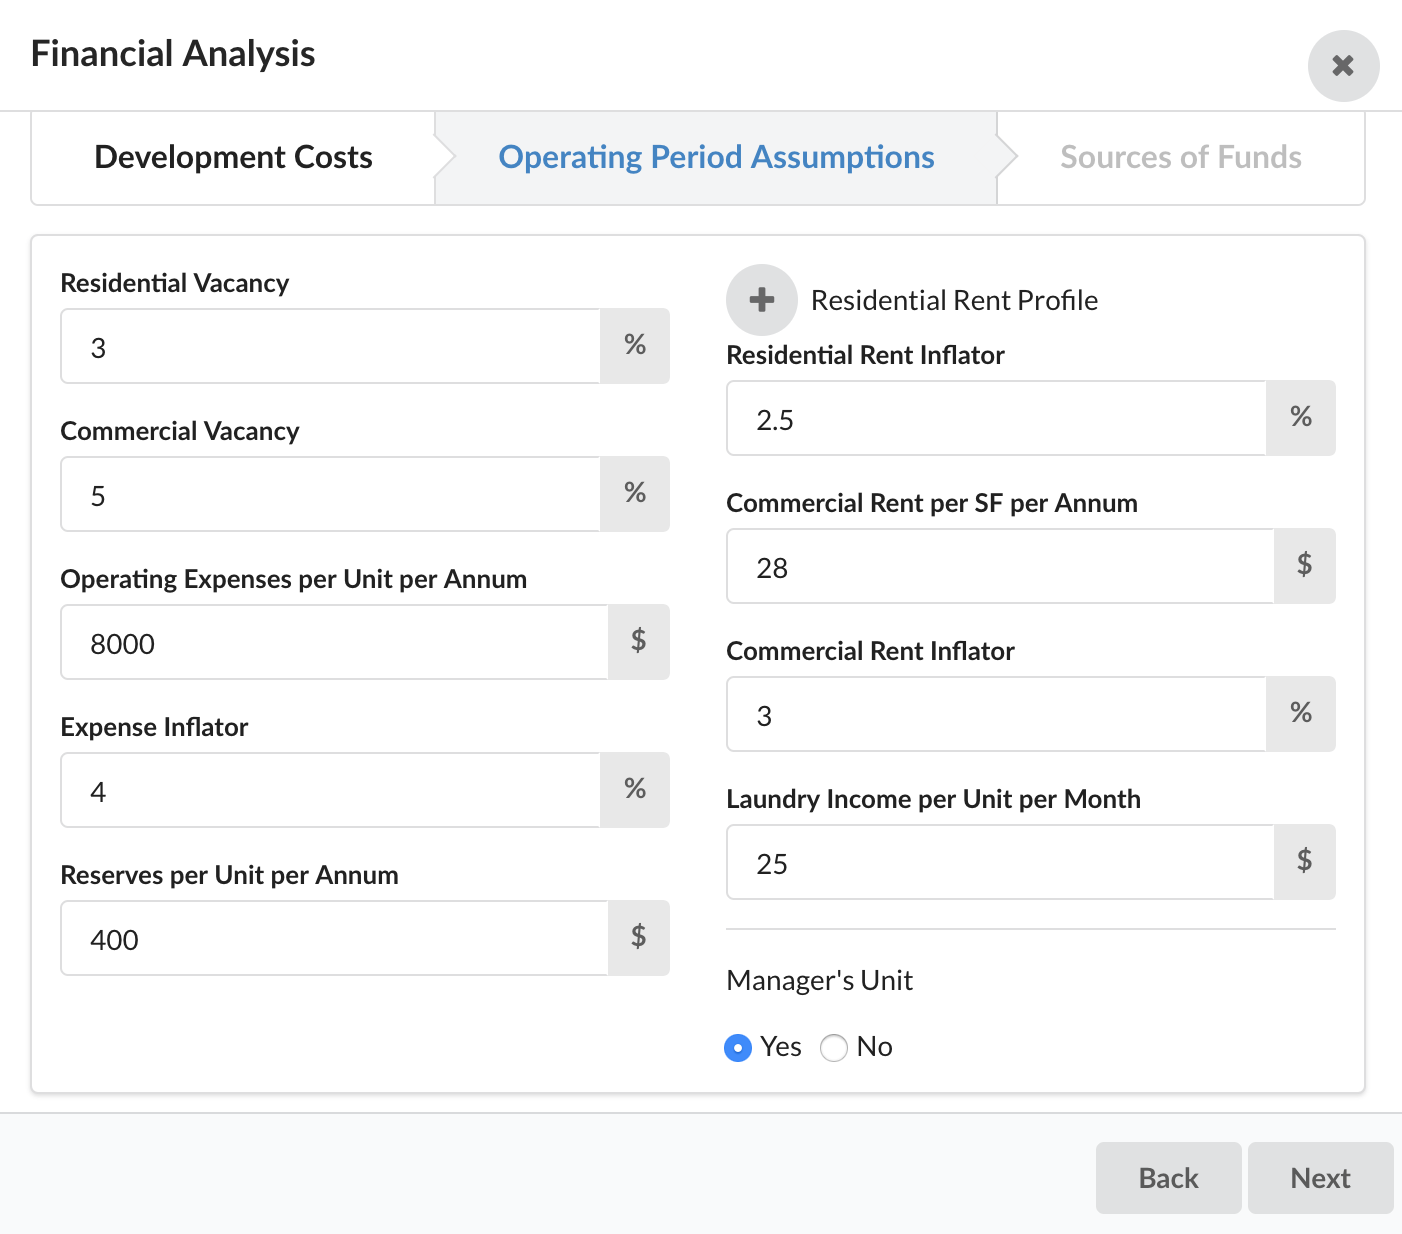
The operating period assumptions will automatically generate a 20-year, pre-tax cash flow. In order to accurately calculate the cash flow, you have to input the residential rents, residential vacancy, rent inflator, operating expenses, reserves and expense inflator. Commercial rents, utility allowances and manager units are additional inputs that will vary by building program. If you indicate the presence of a manager’s unit in the building, the rent from this unit will automatically be subtracted from the rental income in the cash flow. The residential rents, utility allowances and laundry income are expressed on a monthly basis, while the remaining values are annual.
Under Operating Period Assumptions, you can input the following assumptions:
- Operating period assumptions:
Residential vacancy rate
Commercial vacancy rate
Operating expenses (unit per annum)
Expense inflator
Reserves (unit per annum)
Residential rent inflator
Commercial rent inflator
Laundry income (unit per month)
Manager’s unit
Adding a Residential Rent Profile
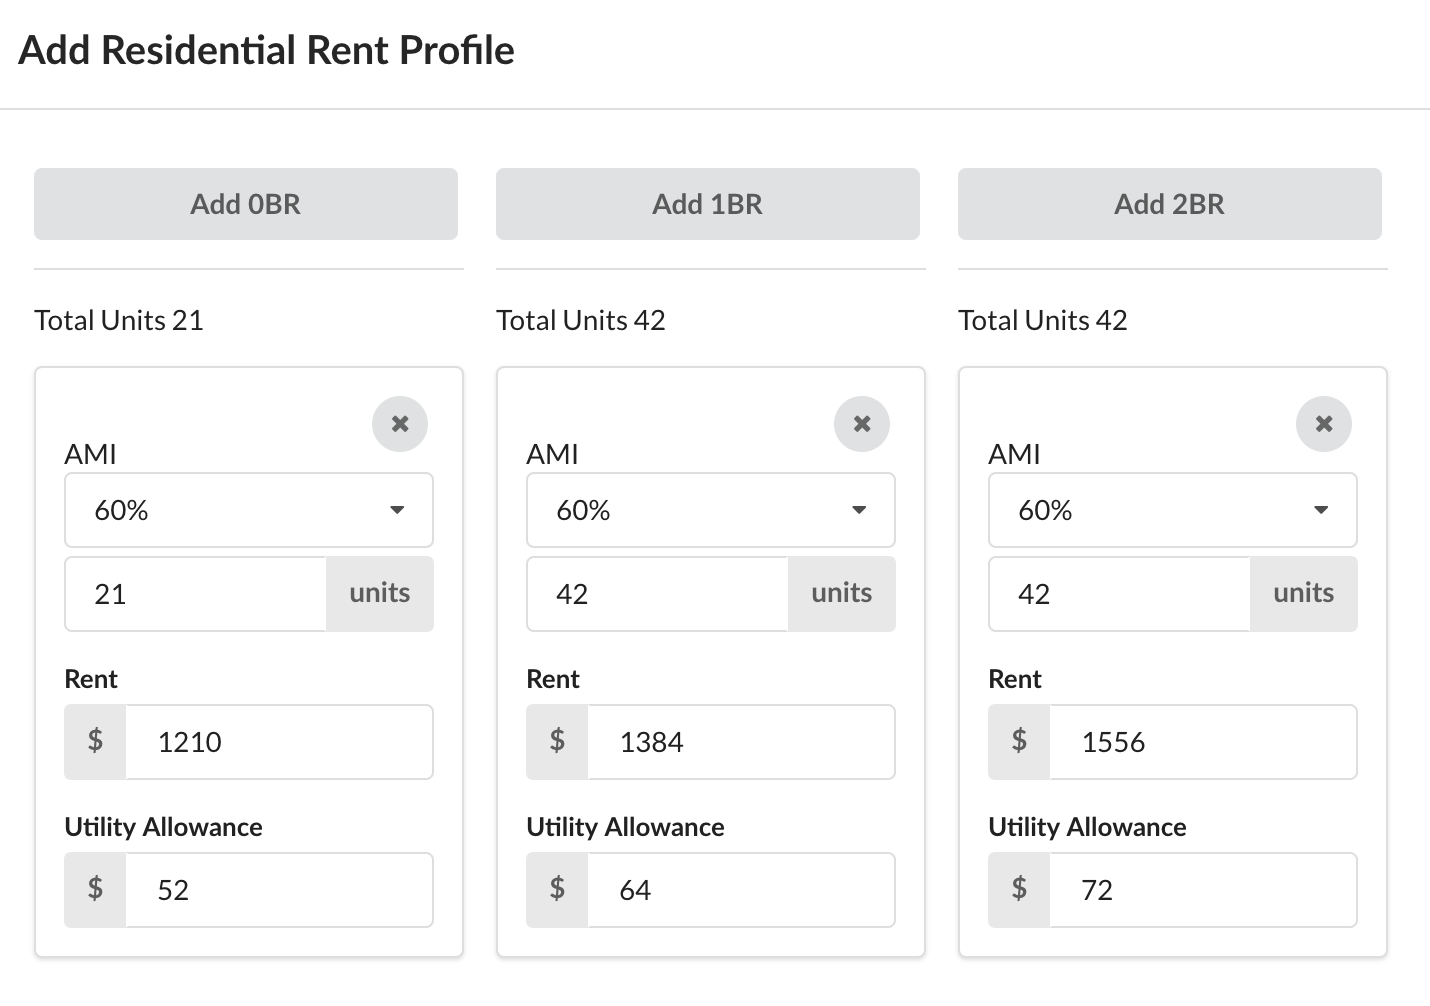
You can add a residential rent profile by breaking down the generated unit mix into different area median income (AMI) levels for each unit type. Rents by AMI level are stored in a database by county and are based on Fair Market Rents (FMRs), including regional adjustments if necessary. The rents stored do not include utility allowances. FMRs are determined annually by Housing and Urban Development (HUD), and they are the 40th percentile of gross rents for typical, non-substandard rental units occupied by recent movers by local housing market. The rents stored for the city of San Francisco are derived from the Unadjusted AMI for the HUD Metro Fair Market Rent Area that contains San Francisco.
A drop-down menu allows you to auto-populate region-specific rents by AMI and unit type, but you can edit any of these values and input custom rents. By adding units from the top of the form you can include more than one AMI level for each unit type. If you add more than one AMI level then you will need to adjust the unit count so that it matches the total unit count by unit type. You can also add values for utility allowances.
- Rent assumptions:
Residential rent per unit type
Utility allowances ($ per unit per month)
Commercial rent ($ per sf/m per annum)
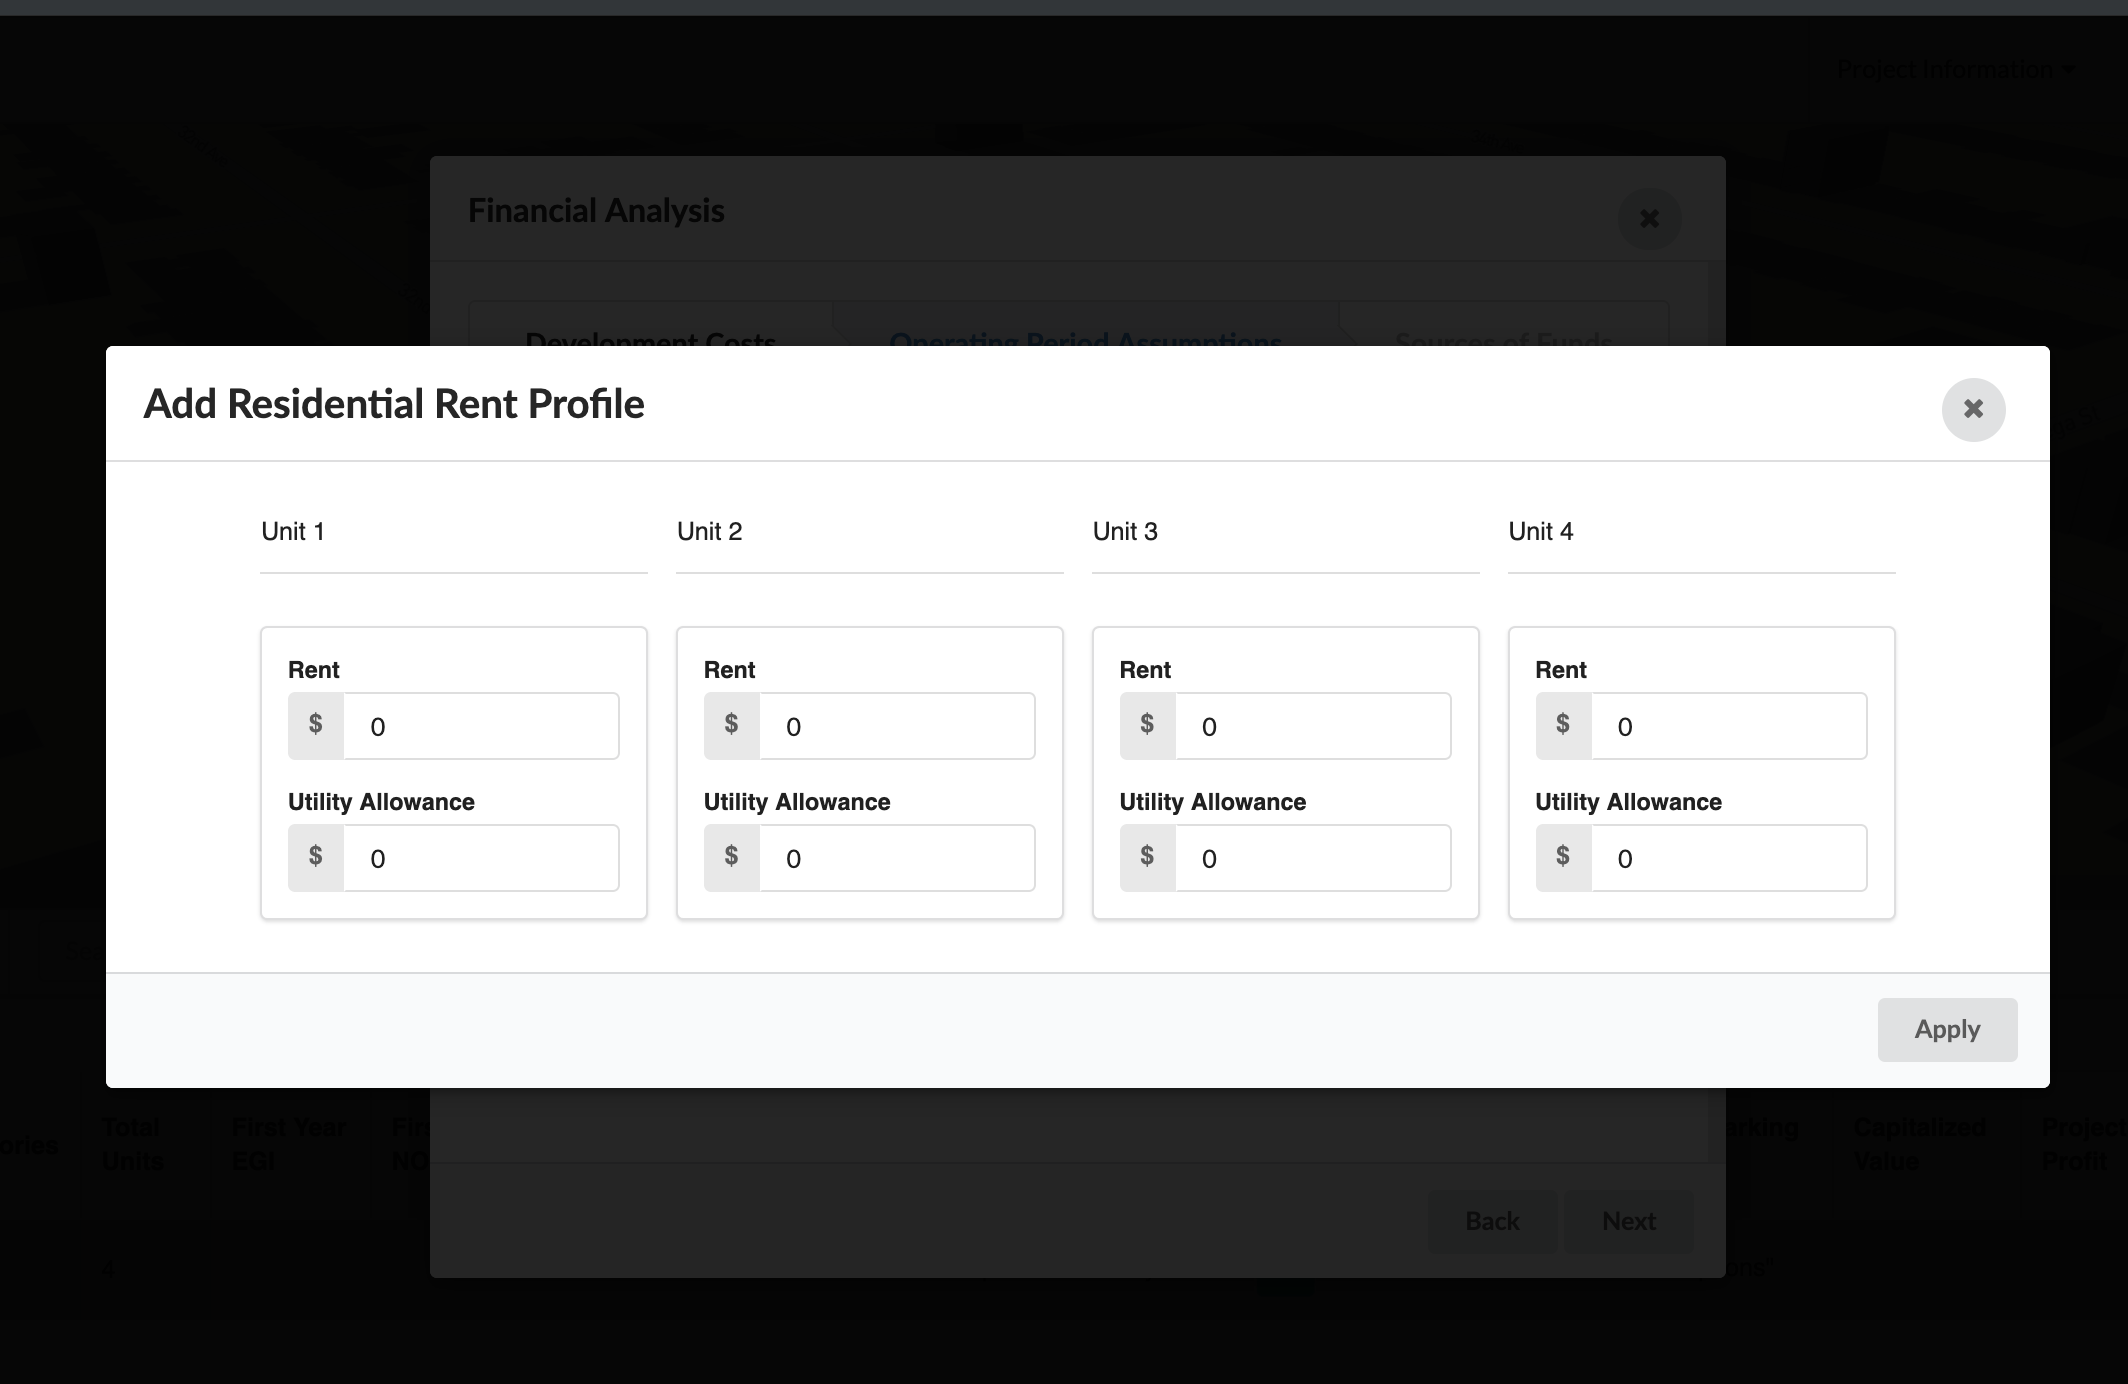
For the Single-Family-Attached building typology, the residential rent profile will be broken down by each individual unit:
Sources of Funds
Under Sources of Funds you can input various sources of debt and equity.
Debt
The first mortgage is generated based on the debt service coverage ratio (DSCR) and mortgage terms indicated by the user. The DSCR is applied to the year 1 net operating income (NOI) generated in the cash flow. In order to calculate the first mortgage, enter the DSCR, amortization period and interest rate. The loan origination fee will be added to the total development cost for that building option.
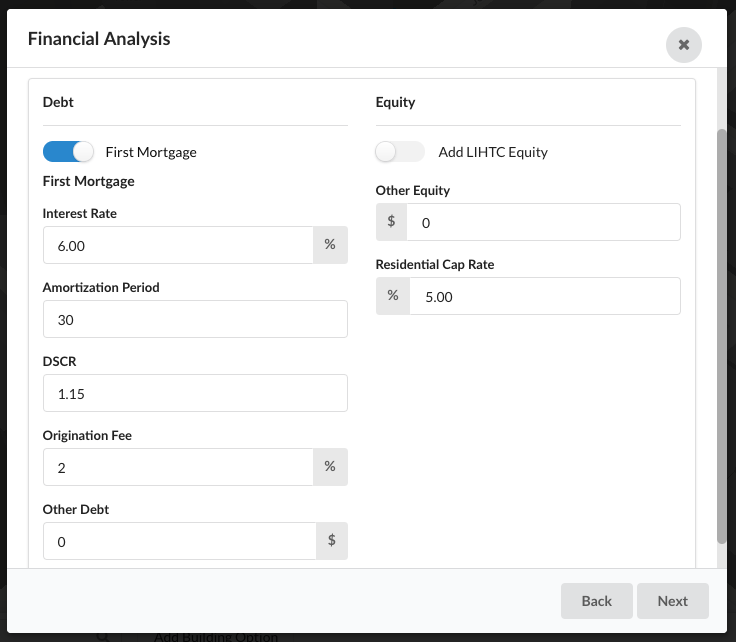
You can add additional debt under Other Debt.
Equity
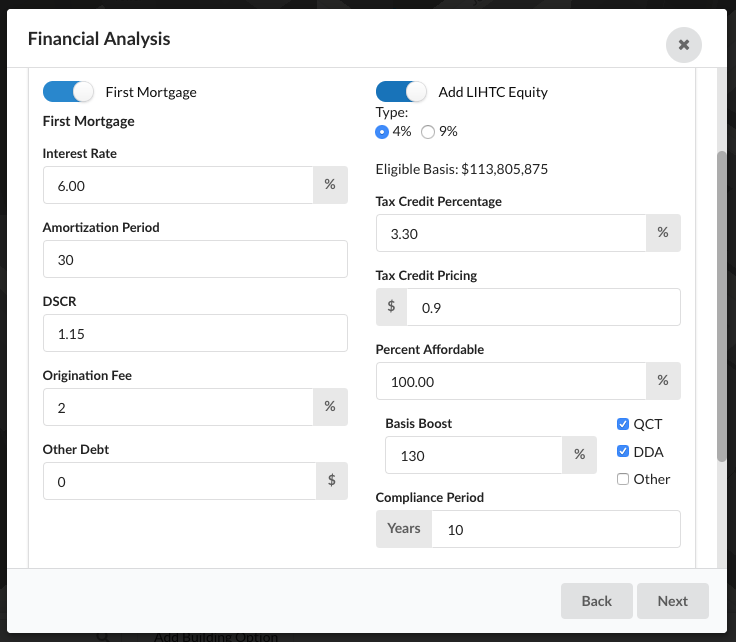
By indicating that you intend to use Low Income Housing Tax Credits (LIHTC), you can generate tax credit equity as a primary source of funds. The Eligible Basis is calculated automatically from eligible development costs.
Selecting 4% or 9% will auto-populate the current federal tax credit percentage, but you can edit this number under Tax Credit Percentage. Under Tax Credit Pricing, enter the current market tax credit price.
Under Percent Affordable, indicate the percentage of the units in the building that will be Affordable. Basis Boost allows you to indicate whether your site is in a Qualified Census Tract (QCT) and/or Difficult to Develop Area (DDA), which allows for up to a 30% basis boost. If there is another element of the project that will make it eligible for a basis boost, that can be indicated under Other. In this case the boost will need to be entered manually, i.e. 115%. The Tax Credit Compliance Period (10 years) is auto-populated based on federal standards, but this number can be manually adjusted.
Under Other Equity you can enter additional sources of equity, such as grants or investor equity, which will be added to the total sources of funds. Further, you can enter the market capitalization rate (cap rate) in order to get a sense of the capitalized value of the completed project.
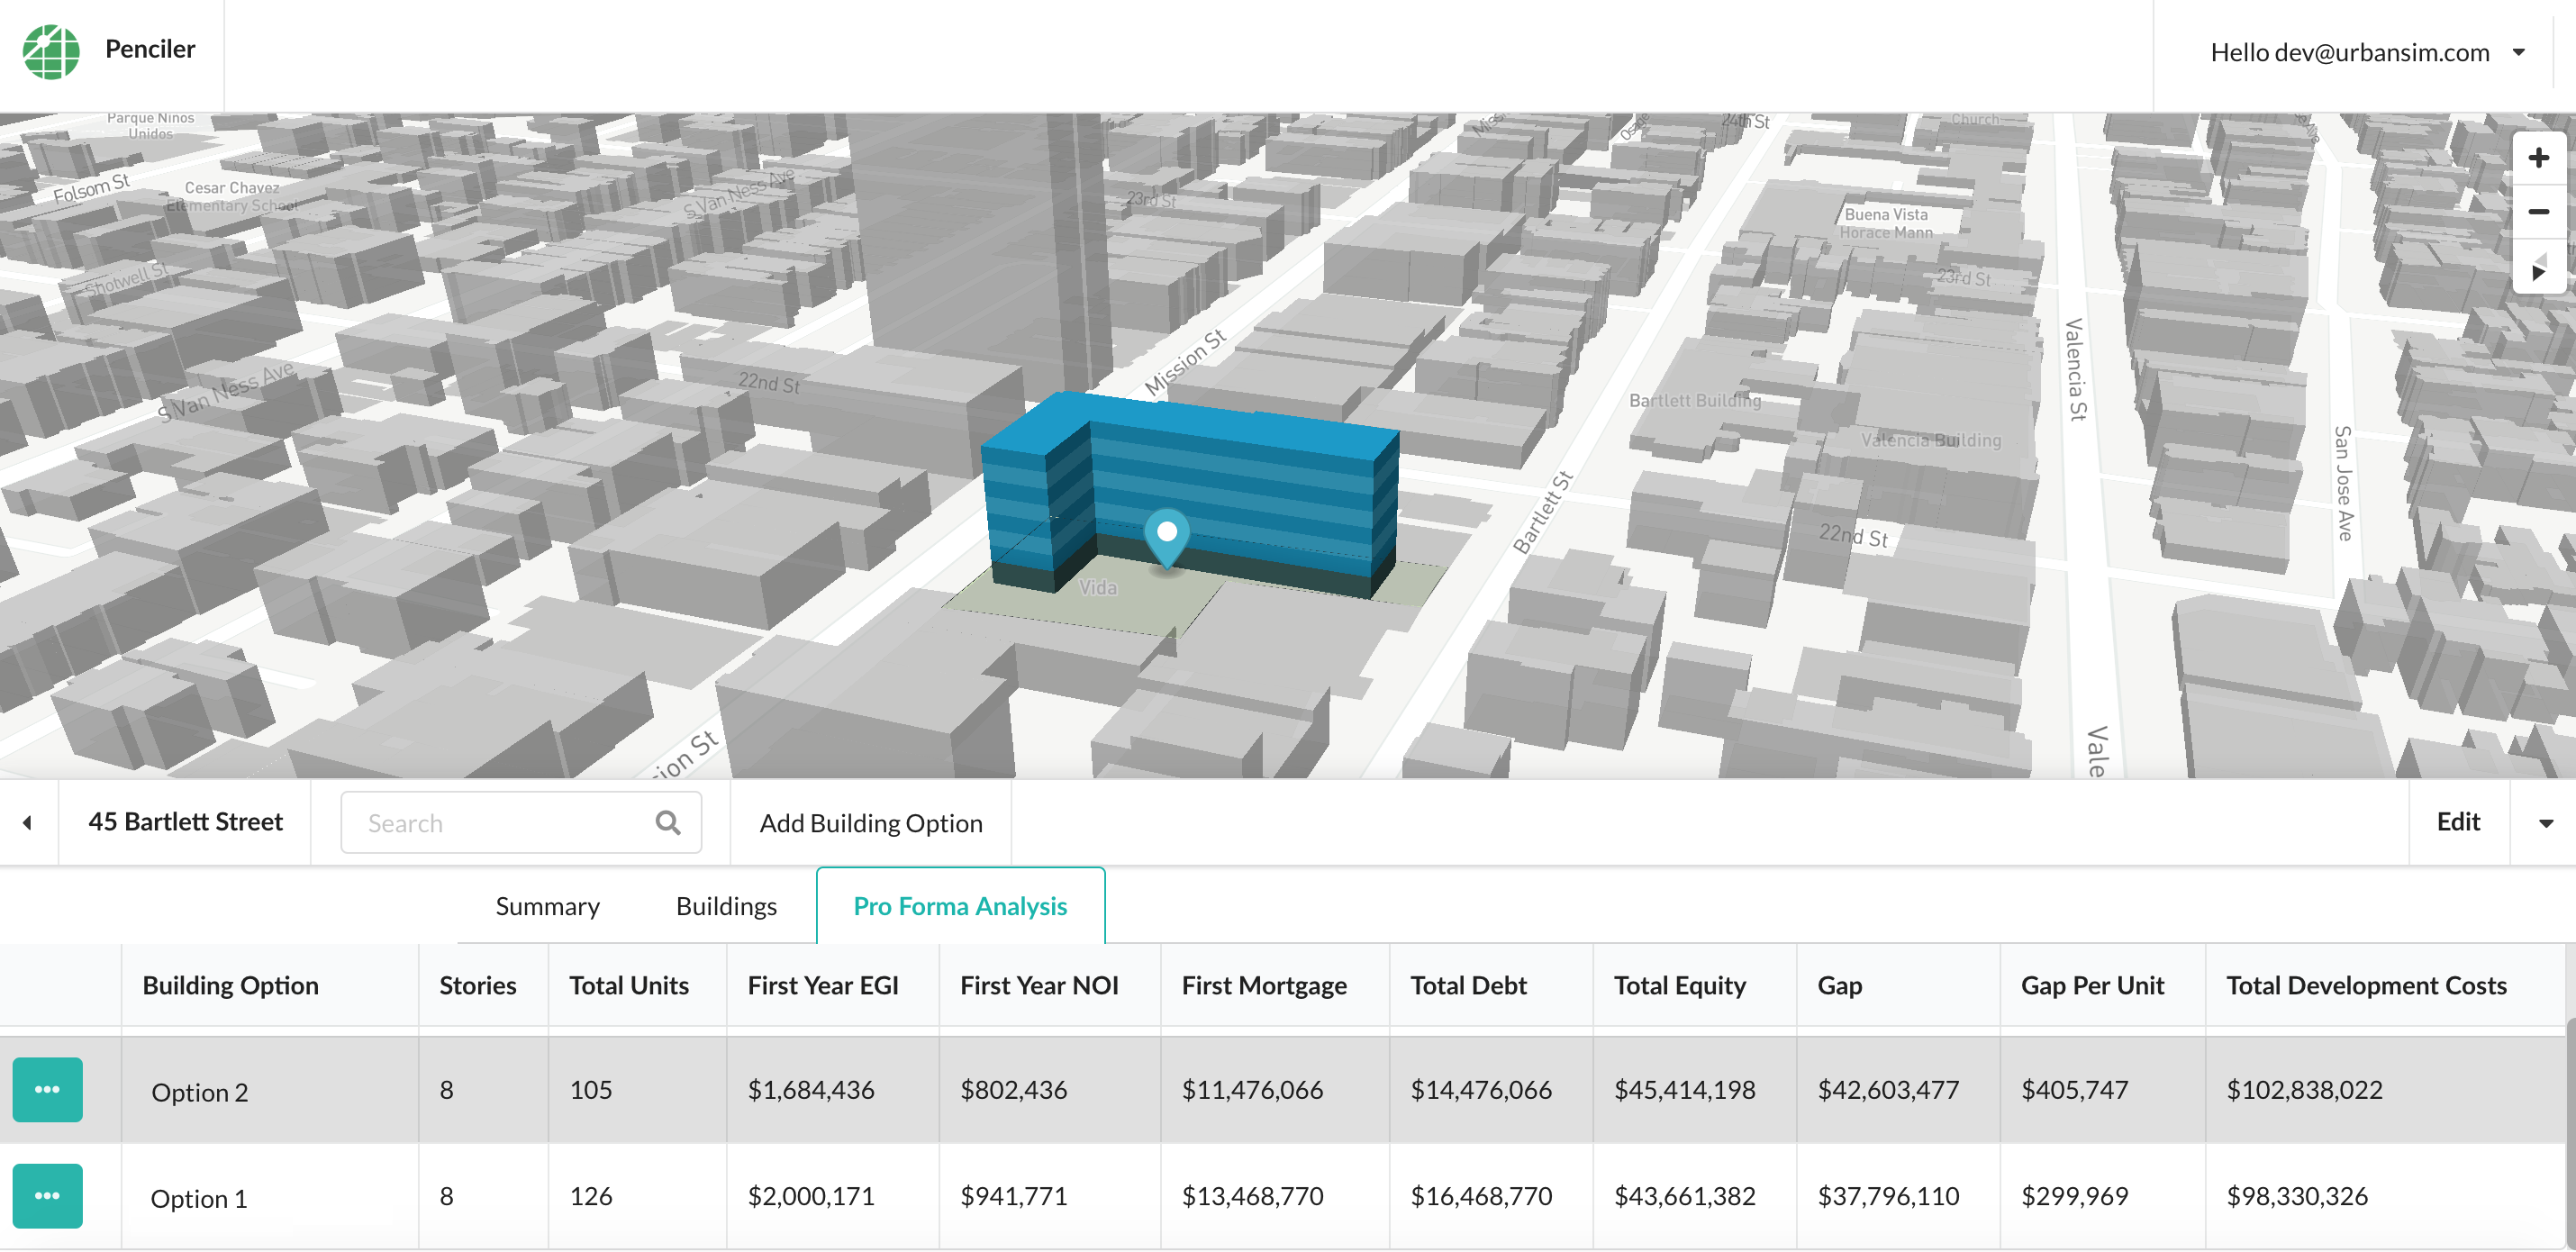
The pro forma analysis output table shows total total debt, total equity, total sources and gap/gap per unit in a table form. Further, it shows certain elements of the 20-year cash flow, such as the year 1 net operating income. Valuation metrics such as capitalized value, project profit, return on cost and yield on cost are also displayed in this table. The financial feasibility table shows these outputs for all building options on the site, allowing you to compare the financial feasibility of many different options.
Cash Flow
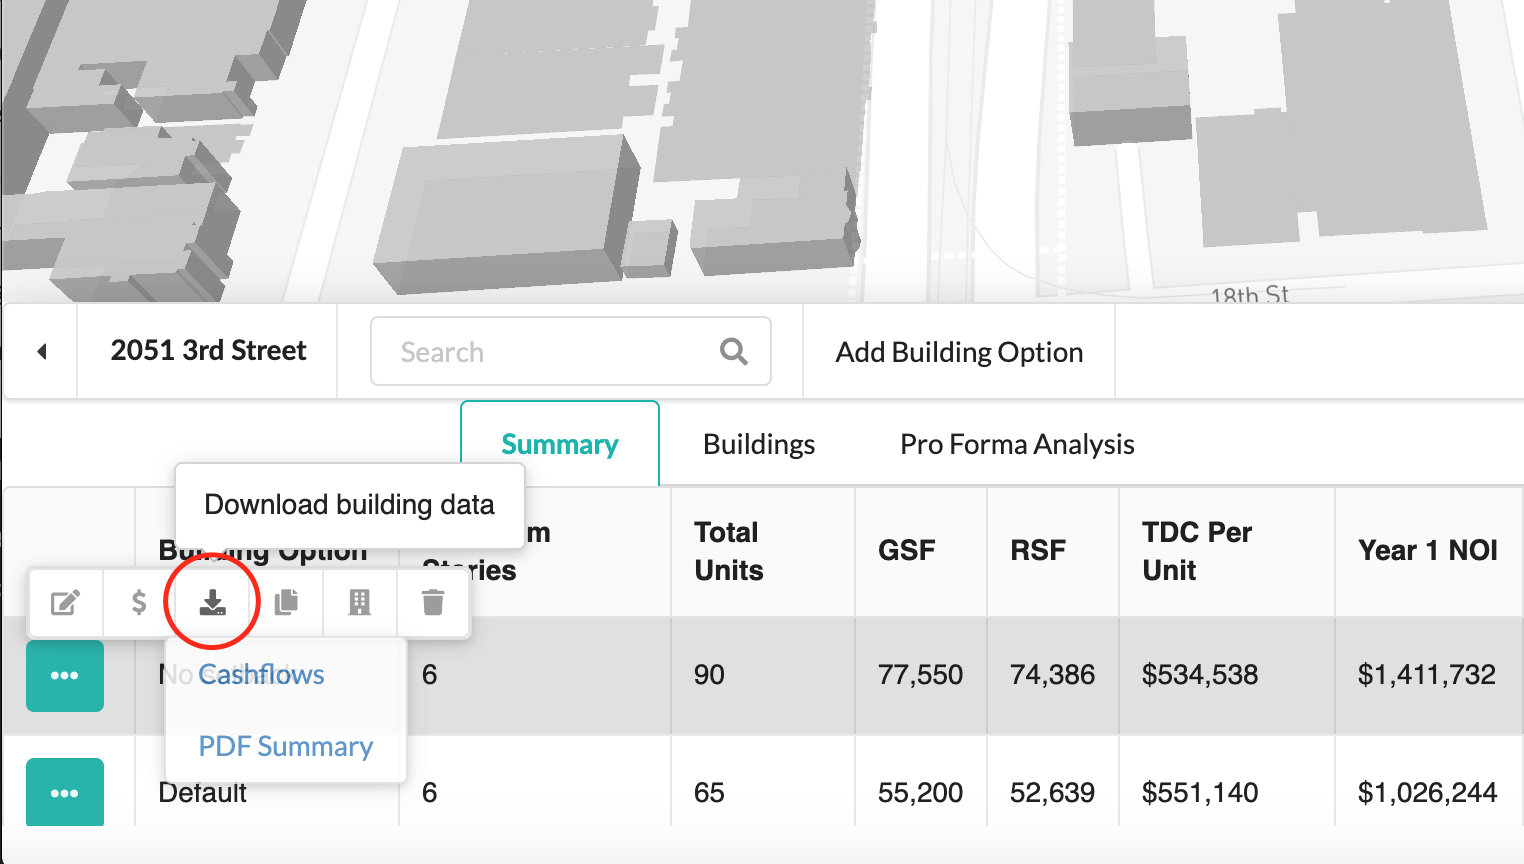
The cash flow generated is available for download in the Summary table. Penciler generates a 20-year, pre-tax cash flow. The cash flow does not show debt payments. You can download the cash flow as a .csv file in the summary table by clicking on the turquoise button next to each building option and clicking the download sign.
Summary
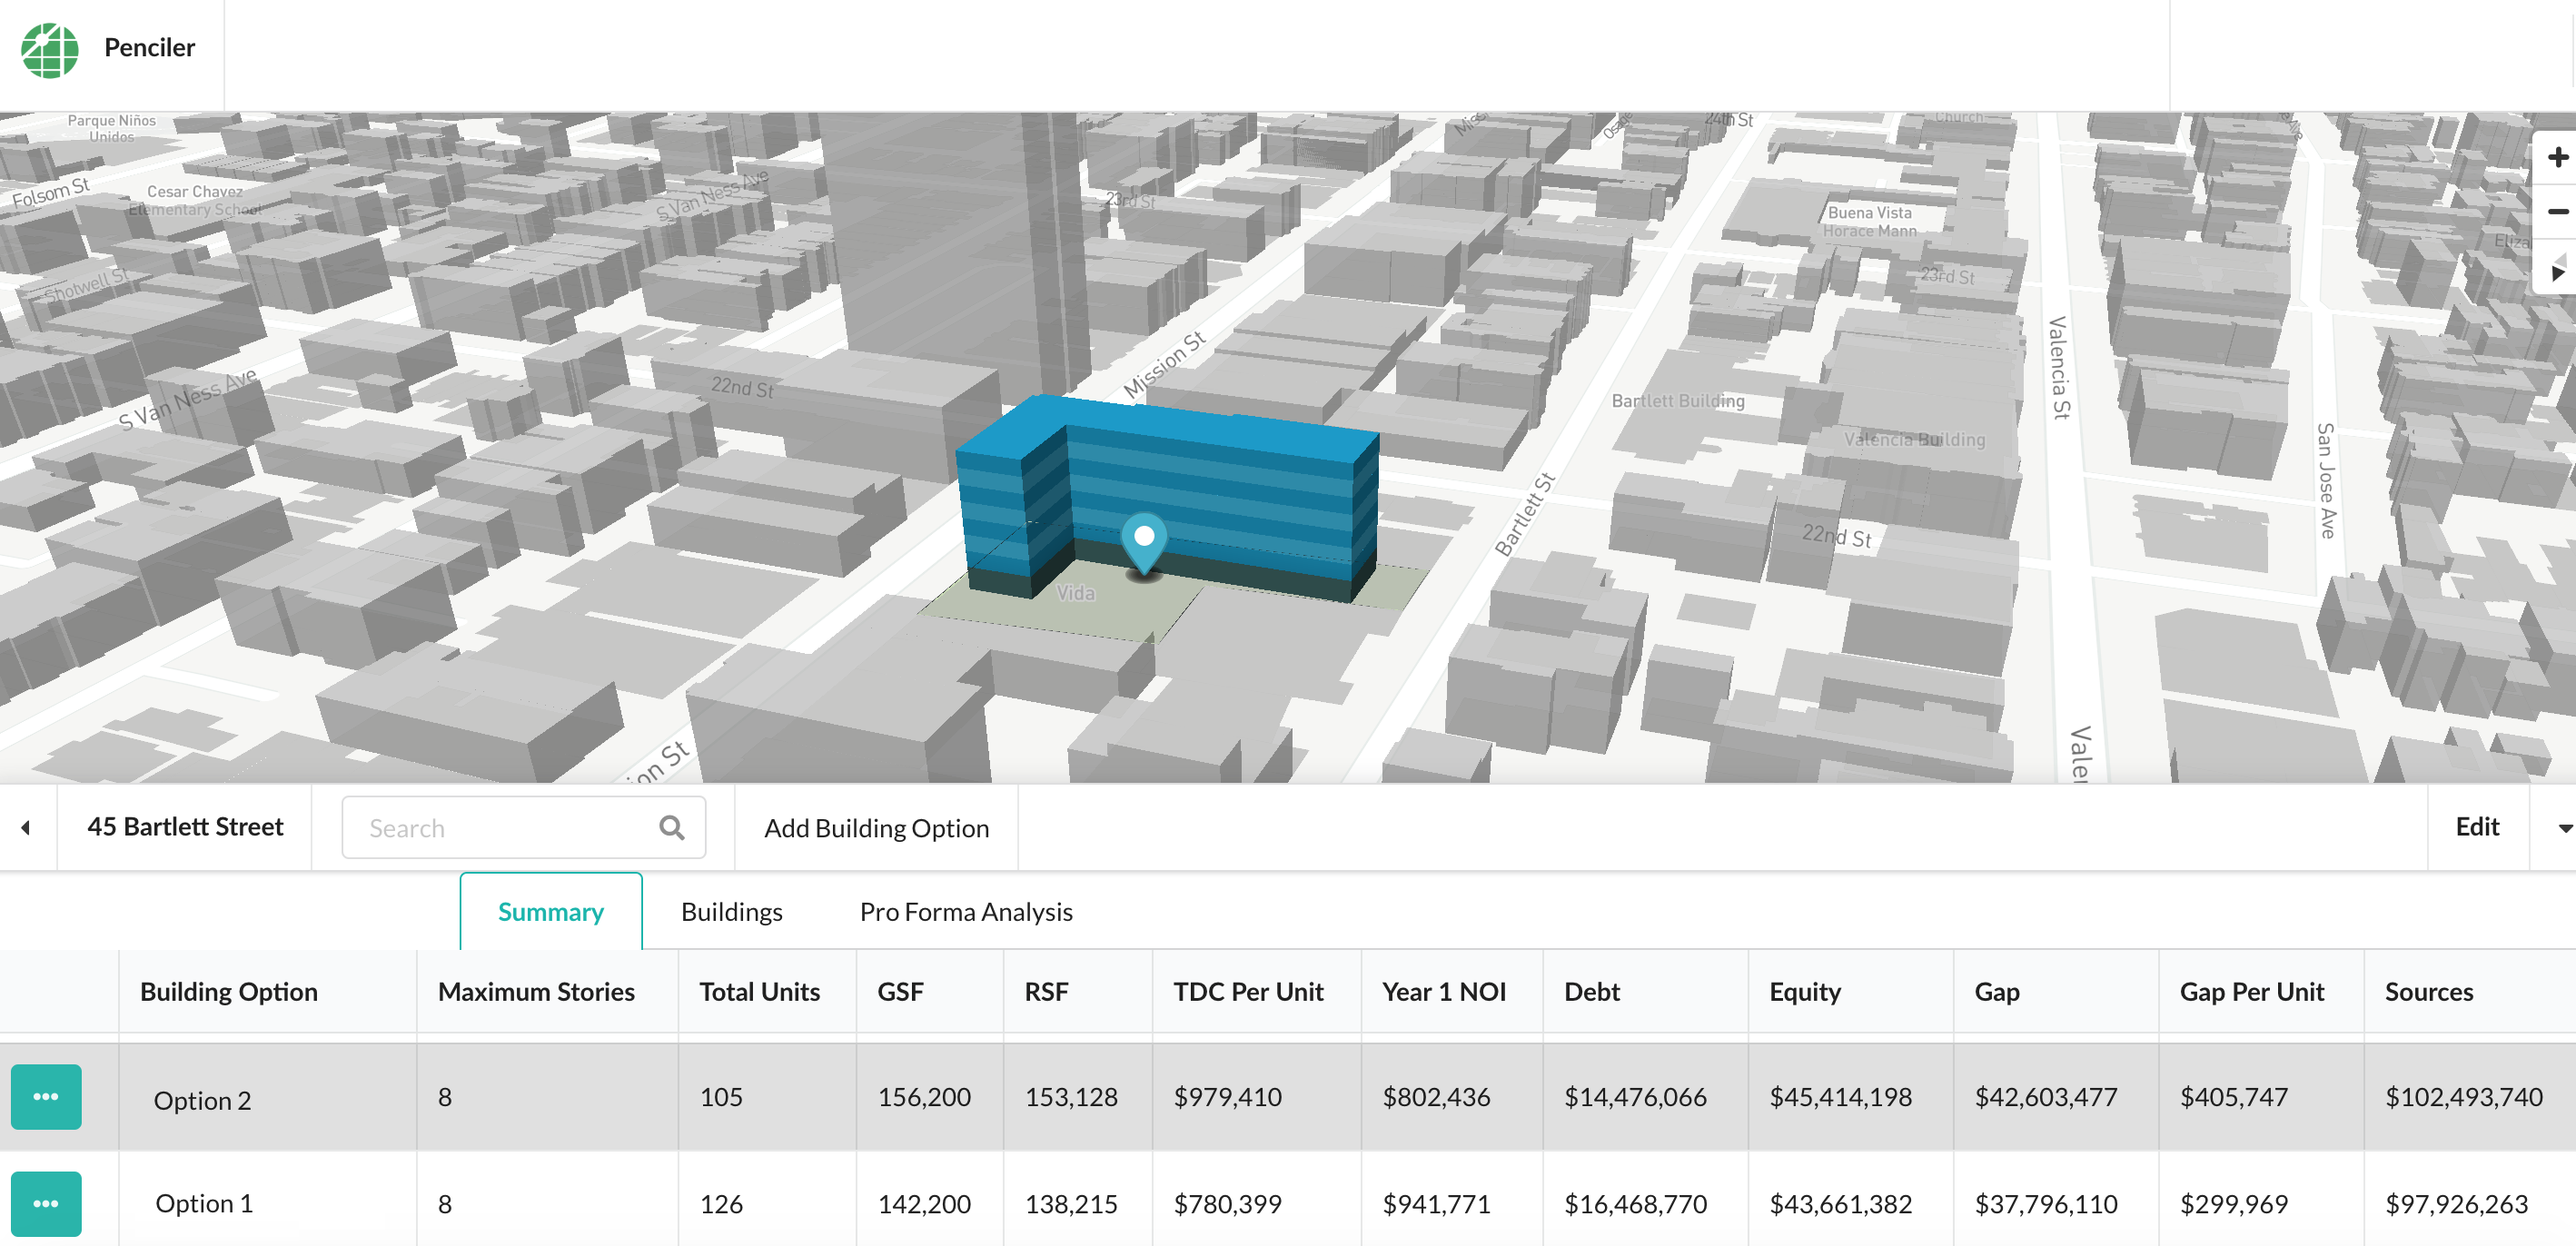
Under Summary you can get a quick picture of the feasibility of multiple options on the same site from a building program, development cost and financial perspective. By navigating between the tabs, you can edit assumptions in any phase of the analysis. Any changes to unit count, for example, will be automatically updated in the development cost analysis.
Vancouver
- There are two important differences in the financial analysis wizard for projects that are created in the Vancouver region:
LIHTC equity will not appear as a user input in the Sources of Funds window
The rent dropdown menu in the residential rent profile window will appear blank. Input rents for each unit type in the rent input box.